4 min read
Buy-side Firms Use TCA to Measure Execution Performance
By Brian Mitchell, Dale Brooksbank, Ian Firth
5 min read

 By Jason Lam, Director - Head of APAC Electronic Equities Quantitative Analytics & Consulting, Deutsche Bank
When measuring transaction costs, a prevalent practice today is to reference price benchmarks that are relevant to the specific algorithm. For example, referencing the order interval market VWAP (Volume-Weighted-Average-Price) for VWAP strategy orders, arrival price for IS (Implementation Shortfall) orders, etc.
The price benchmark slippage can then be computed by comparing the order average price to the reference price. This methodology is widely accepted and almost universally applied within the industry.
For over a decade, this has been the de facto standard to examine algo performance, to evaluate whether best execution has been achieved, and to compare performance across strategies or brokers for each of the trading objectives. However, when presented with results drawn upon these traditional metrics, do we often find ourselves asking the question “is this good or bad”? Surely, if this methodology is not effective in answering this, we must continue to seek a better solution!
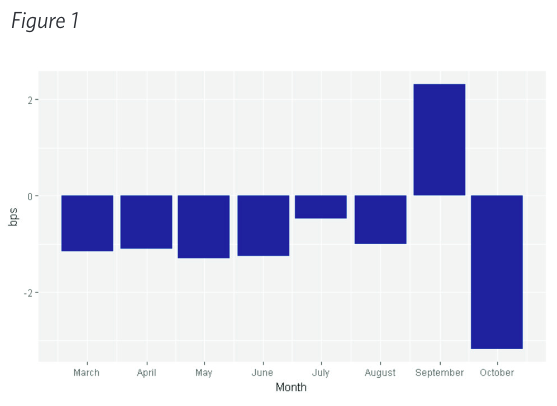
Figure 1 presents typical results of performance slippages. These measures are inherently noisy and sometimes misleading. Directional market moves and stock specific volatility tend to skew these measures significantly, where higher volatility likely yields higher deviation from benchmark. For example, if an IS order managed to beat the arrival benchmark by 2 bps (basis points), most would be overjoyed with this performance but “is this good or bad”? What if the majority of market trades were executed at even better prices? The optimism would quickly turn into disappointment. To counter these issues, the industry has continued to innovate new techniques to separate noise from signal – from normalizing slippage numbers in relative terms by representing them in spread instead of bps, to applying adjustments based on pre- and/or post-trade models.
These models evolve over time and have gotten more complex and sophisticated. New factors were added to these models, including beta, stock-specific volatility, liquidity conditions, impact estimates, etc. Furthermore, many agency brokers (Deutsche Bank included) have their own proprietary models, which makes it difficult for clients to compare adjusted-performance numbers across brokers. Many clients find themselves having to apply adjustments themselves to reduce noise in these metrics. More importantly, how do we actually evaluate the effectiveness of these adjustments?
If an objective method existed to measure this, should we not directly apply it to measure transaction cost? Absolute EBEX is one answer.
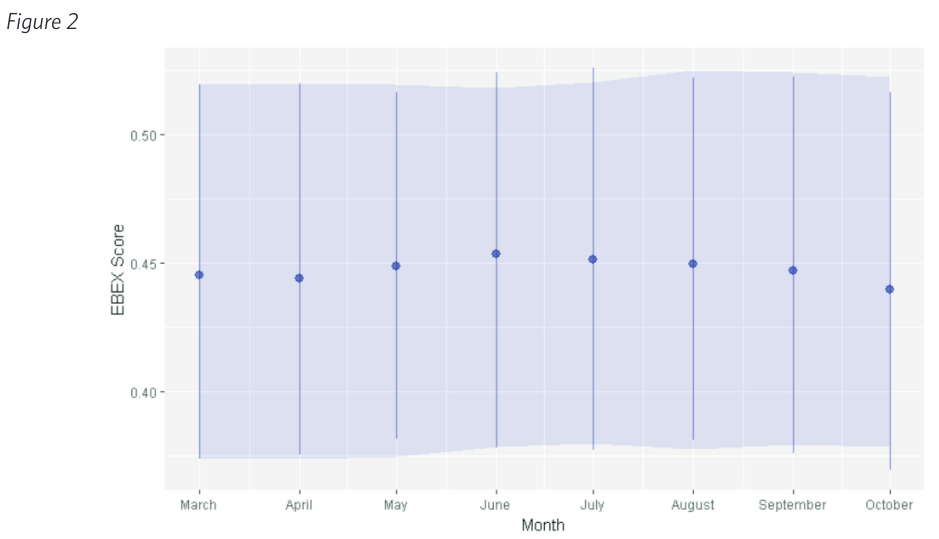
Traditional slippage metrics only provide the magnitude of slippage and not insight to where this compared to others or the market. An effective measure must then include a component of peer group analysis. Absolute EBEX is an absolute performance measure proposed by the EDHEC Business School in France as part of the EBEX (EDHEC Best Execution) framework1 for TCA (Transaction Cost Analysis). It quantifies the quality of execution with a simple score between 0 and 1, the higher the better. Absolute EBEX can be understood as the fraction of market volume traded at or worse than the order average price. Suppose half of market volume traded at prices better than the order average price, the order would achieve a score of 0.5. We find this analysis intuitive and simple to implement, only requiring final order average price of individual orders and market trade data.
EBEX provides a standardised framework to assess the quality of execution across orders aggregated at any level. It is also generally free of noise typically found in traditional price benchmark slippage. With these advantages, an effective systematic review process may be introduced to evaluate best execution, which is key to achieve the best possible results through agency algorithms. To monitor for changes in execution performance per strategy and market, one could simply observe the distribution and aggregated absolute EBEX scores. The stability of aggregated absolute EBEX score allows for the introduction of an expected performance band by defining an appropriate lower and upper bound based on acceptable tolerance level, such as a multi-month rolling average of 35 and 65 percentile respectively. In addition, absolute EBEX as an absolute measure allows for a definitive minimum threshold defined by a constant, such as 0.3. In figure 2, we present the absolute EBEX score over a sample set of VWAP orders. The round dot represents aggregated score over each month. The vertical line represents the distribution of EBEX scores between 35 to 65 percentiles. The shaded zone represents the acceptable performance band, which is a rolling 2-month average of 35 and 65 percentile respectively. Also, note the stability of aggregated EBEX score and its distribution month over month, as compared to figure 1. Both figure 1 and figure 2 are based on the same underlying order set. The EBEX analysis identified a drop in performance in October but was significantly less pronounced than what traditional slippage shown. Indeed, a deeper investigation found higher volatility in October having skewed traditional TCA.
Alongside absolute EBEX, EDHEC also introduced directional EBEX as part of the EBEX framework. The goal of directional EBEX is to evaluate whether the correct time horizon had been chosen to trade the order by comparing NBBEX (Number of Before-Better Executions) and NABEX (Number of After-Better Execution), which can be understood as the analogous of absolute EBEX within the order interval, and the period between order end time and market close respectively.
For schedule-based algorithms, such as VWAP and TWAP (Time-Weighted Average Price), clients may prefer to define the trading horizon by specifying the start and the end time of the order. In such cases, we find it more appropriate to use NBBEX over absolute EBEX to evaluate performance only within the order interval.
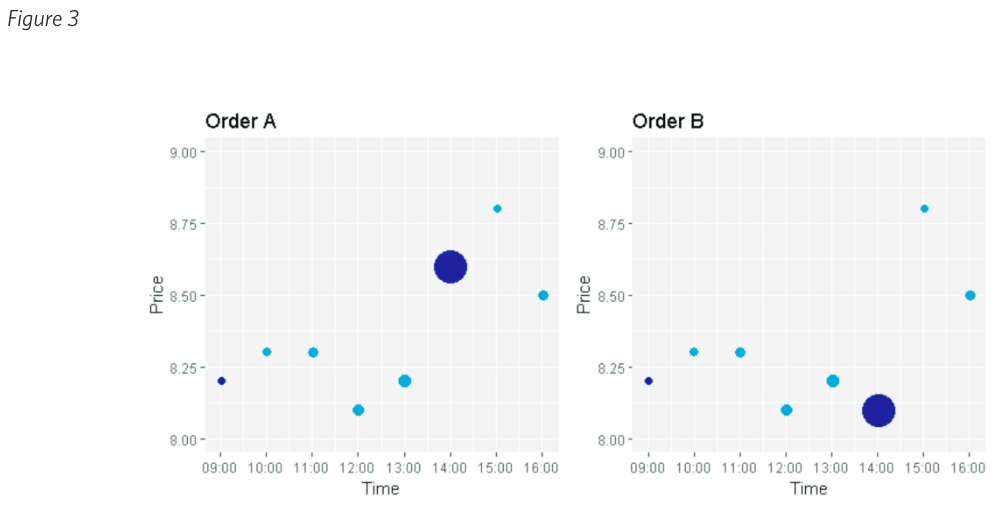
For shorter duration orders, where orders are more likely to be a larger part of interval volume (IV), we propose a minor adjustment to exclude own order flow. Consider 2 Buy orders in figure 3. Each order having only 2 executions, and the price of the latter and larger execution of each order being the only difference between the otherwise identical orders. The size of the bubble represents the relative trade size. The color of the bubble represents order execution and market trades in dark blue and light blue respectively.
One would prefer the performance of order B to order A because the bulk of its executions were done at the low prices of the order interval as opposed to the near-high. However, the NBBEX score does not reflect this, yielding a score of 0.89 and 0.11 for order A and B respectively, which is the opposite of our preference. Order A scored well under NBBEX because the latter execution itself already accounts for 87% of interval market volume and traded at a price higher than the order average price. NBBEX therefore has included its own execution as the fraction of market volume having done at or worse than its order average price.
By excluding own order execution, the modified NBBEX yields 0.15 and 0.85 respectively. We compute this by excluding own order executions at or worse than the order average price from market volume within the same price range, and dividing it with the order-interval market volume. Modified NBBEX converges with the original as the Interval Volume percentage of the order decreases. The implementation of modified NBBEX only comes at the extra cost of having to identify the executed volume of individual orders executed below the order average price but this information should be readily available.
EBEX provides a standardised TCA framework to evaluate the quality of order executions aggregated across any level. Deutsche Bank has included EBEX as part of our formal Best Execution review process in APAC. definition of EBEX is intuitive and easy to implement. It is a form of peer group analysis by considering all trades in the market, and generally free of noise typically present in traditional price benchmark slippage. It’s an absolute measure based on a simple score between 0 and 1, where clear objectives can be defined, such as a minimal performance threshold. It is also a versatile measure without having to define relevant and specific reference benchmarks to measure each algorithm. We believe EBEX to be an effective measure and should be included in the suite of standard TCA metrics.
4 min read
By Brian Mitchell, Dale Brooksbank, Ian Firth

4 min read
Christian Sewing, chief executive of Deutsche Bank, said the firm has received unsolicited interest to purchase businesses it is closing as it aims...

6 min read
By Benjamin Gunnee While Madoff maybe a dirty word for many investors, the scandal at the end of 2008 certainly helped propel the often forgotten...